Major 
Drives: F82 M4
Join Date: Nov 2008
Location: Anaheim, CA
|
There's a difference between measuring power, and measuring performance.
Power is just one aspect of performance, and while 600 horsepower sure sounds
a whole lot cooler than 450 horsepower, what determines where you stop before
you inadvertently find out that you've already gone too far?
If you speak to an OEM Engineer they're likely to tell you that anything beyond
stock is a compromise. For them, total performance includes the ability to outlast
more so than it is to simply out perform.
If you talk to a Race Engineer he may tell you that you need to push just past
the limit before you know how far is far enough. For them, performance is
specifically about the ability to out perform, just long enough to finish.
At VF Engineering we see the logic and value in both perspectives and do our
best to learn where the compromise begins, while trying to decide how far is
far enough for our target customer.
TWO Dynos

Underneath the X6M is our Mustang MD-AWD-500 dynamometer.
This is definitely the workhorse of our shop. 98% of our tuning is done on the
Mustang as it's one of the most capable machines available for our type of
business. The mechanically linked rollers synchronize the front and rear wheel
speeds, while the eddy current power absorbing unit simulates road load. This
allows for the most precise measurement of power in a controlled environment
which is hugely beneficial to our tuning process.
While Mustang's are sort of dubbed as the "heart-break" dyno due to the fact
that they tend to produce less than optimistic numbers, our tuning goals are
not necessarily based on peak numbers anyways, but more focused on delta
which is specifically the variation of change between runs.
When using the Mustang it's not uncommon for cars to spend days, or even
weeks at a time while we explore different calibration strategies to achieve our
desired results. Often times we are running vehicle under high loads so we can
measure the effects of increased power on key engine components.
(IE: Adding probes to the exhaust manifold to precisely measure EGTs)
A thorough combination of in-house testing on the dyno, and on-road testing
using data-logging to monitoring the changes under real world conditions, allows
us to subject our test vehicles to rigors that (in most cases) exceed the driving
conditions and usage we expect to see from our customers.
Underneath the M4 is our Dynojet 224xLC dynamometer.
The LC stands for "load control", which combines the ease of use of both an
inertia type dyno with an eddy current load absorption system for advanced
testing capabilities. This will see some use for light duty tuning, but mostly for
producing our measured results on 2 wheel drive applications.
Dynojet has become somewhat of an industry standard for measuring and
comparing as they are known to produce more "optimistic" numbers.
"Optimistic", "realistic", "heart-breaker", however you may refer to the
numbers, the results should always be about the delta before & after rather than
the peak numbers on their own.
Aside from what people consider to be the more "marketable" numbers, we prefer
to use our DynoJet for it's measuring capabilities as it gives us the best ability
to overlay multiple runs and look for consistencies or inconsistencies as we push
the car in back-to-back-to-back-to-back runs. The purpose of these multiple run
groups is to track the changes as temperatures increase, or as we make subtle
calibration changes for fine tuning.
As you can see below, the consistency of our HEX Tuning Stage TWO runs in
the sequence below is quite impressive.
(5 runs in a row with 30 seconds rest, then a 10 minute rest before runs 6-7.) 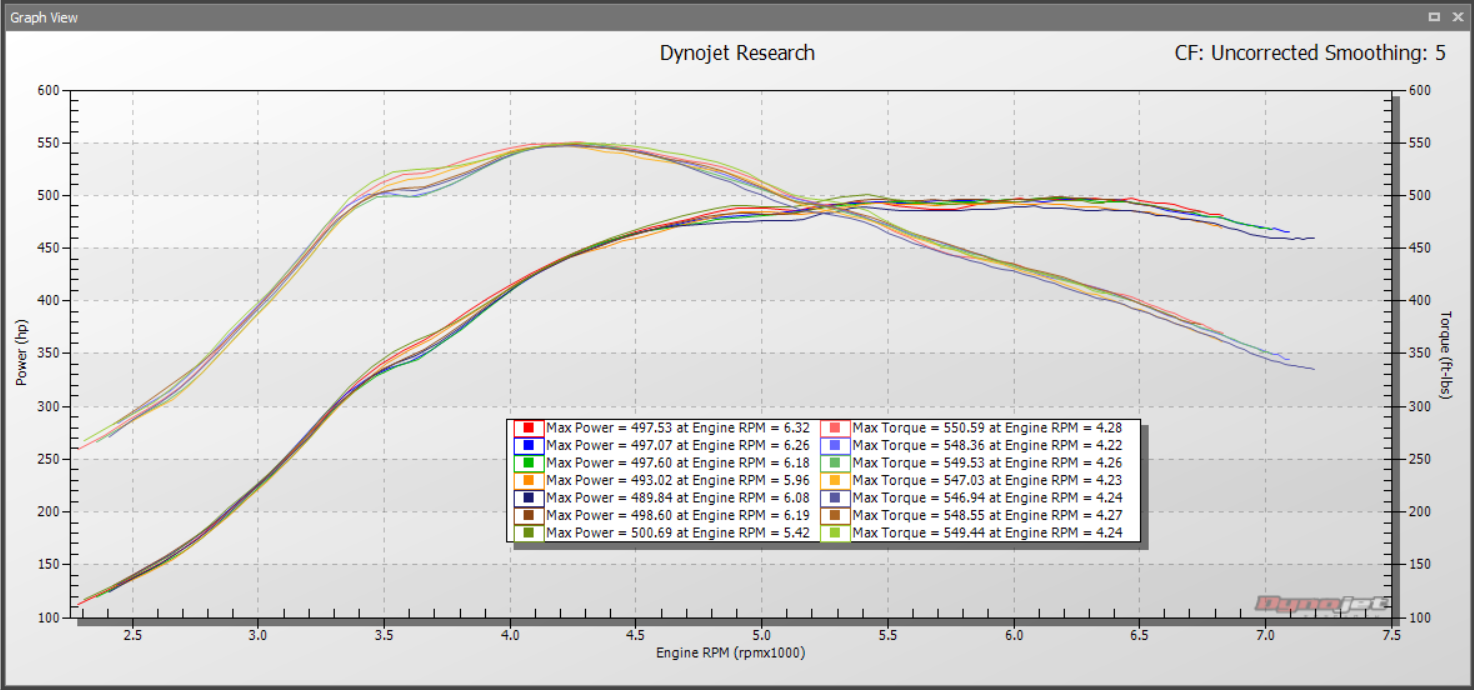
Reading the results.
While it's pretty common to see single run comparisons, the more run examples
the better. The following plots will give you an idea of how a single run on it's
own doesn't necessarily mean much without something to compare it to.
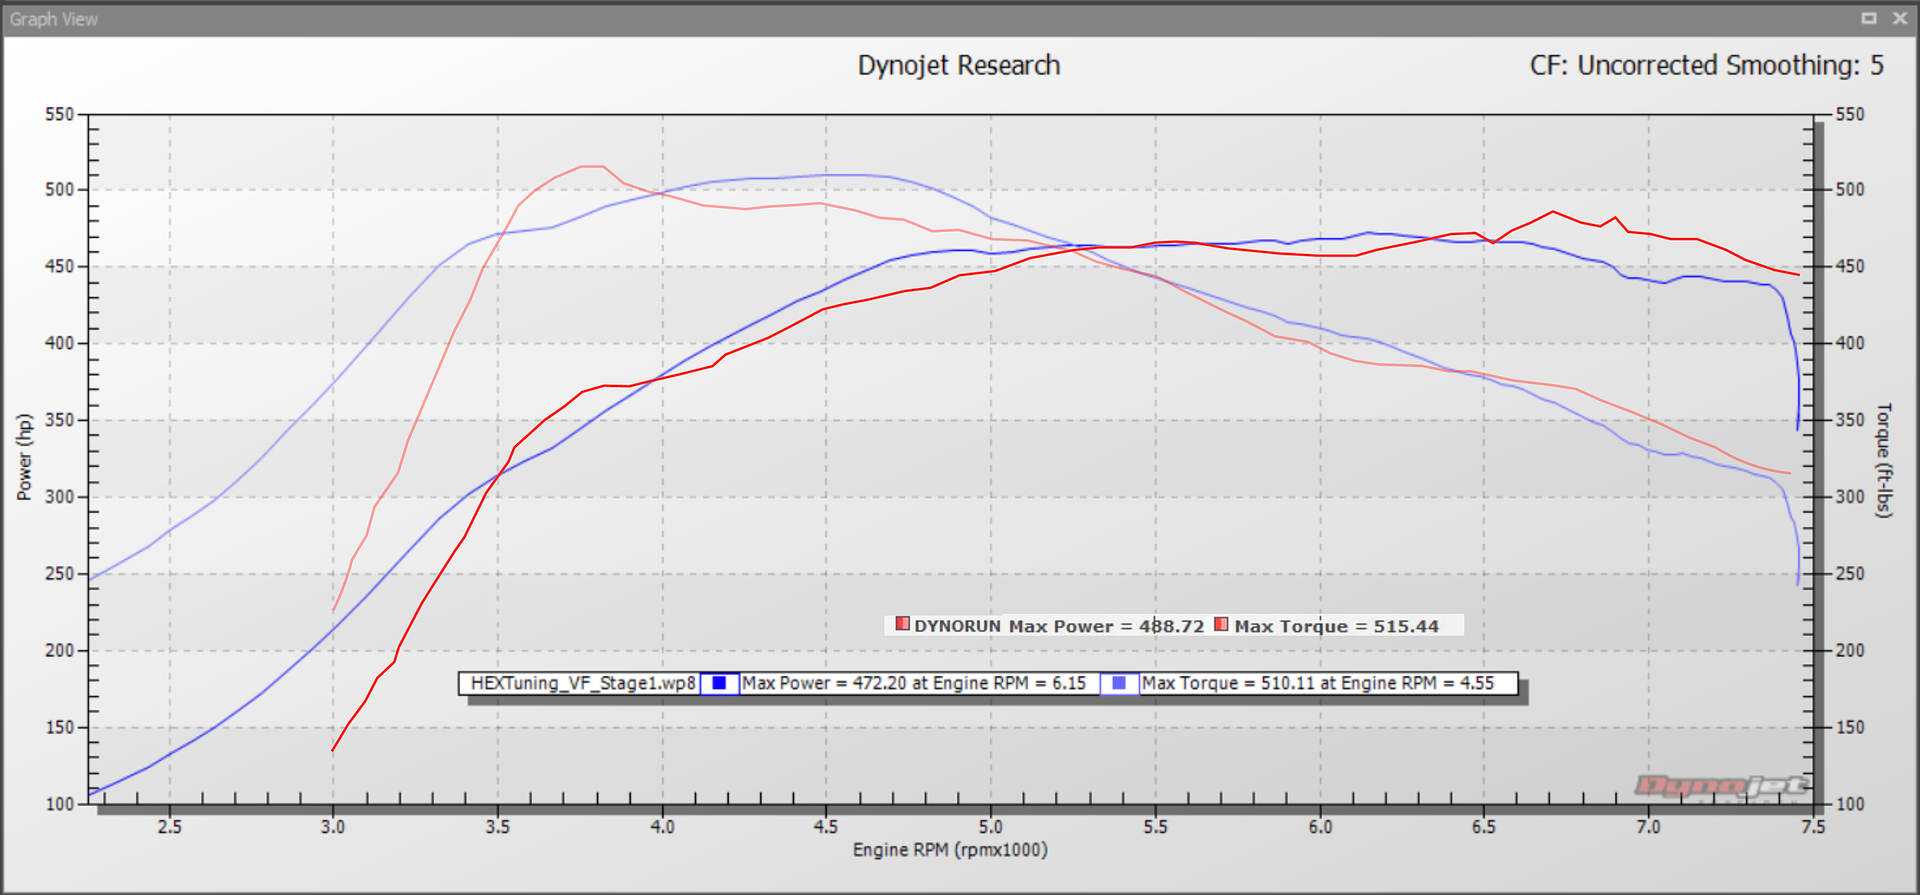
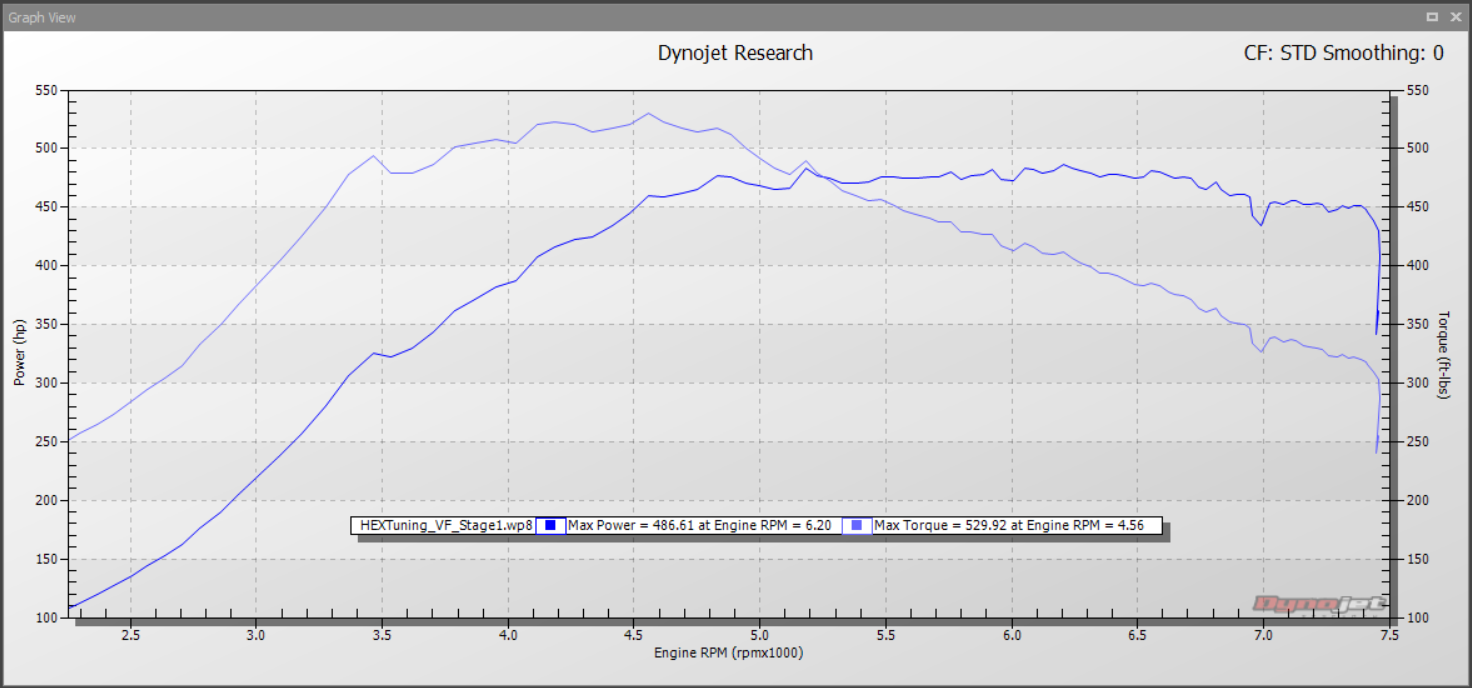
Stage ONE - STD Correction | Smoothing 0 - 486HP 529TQ
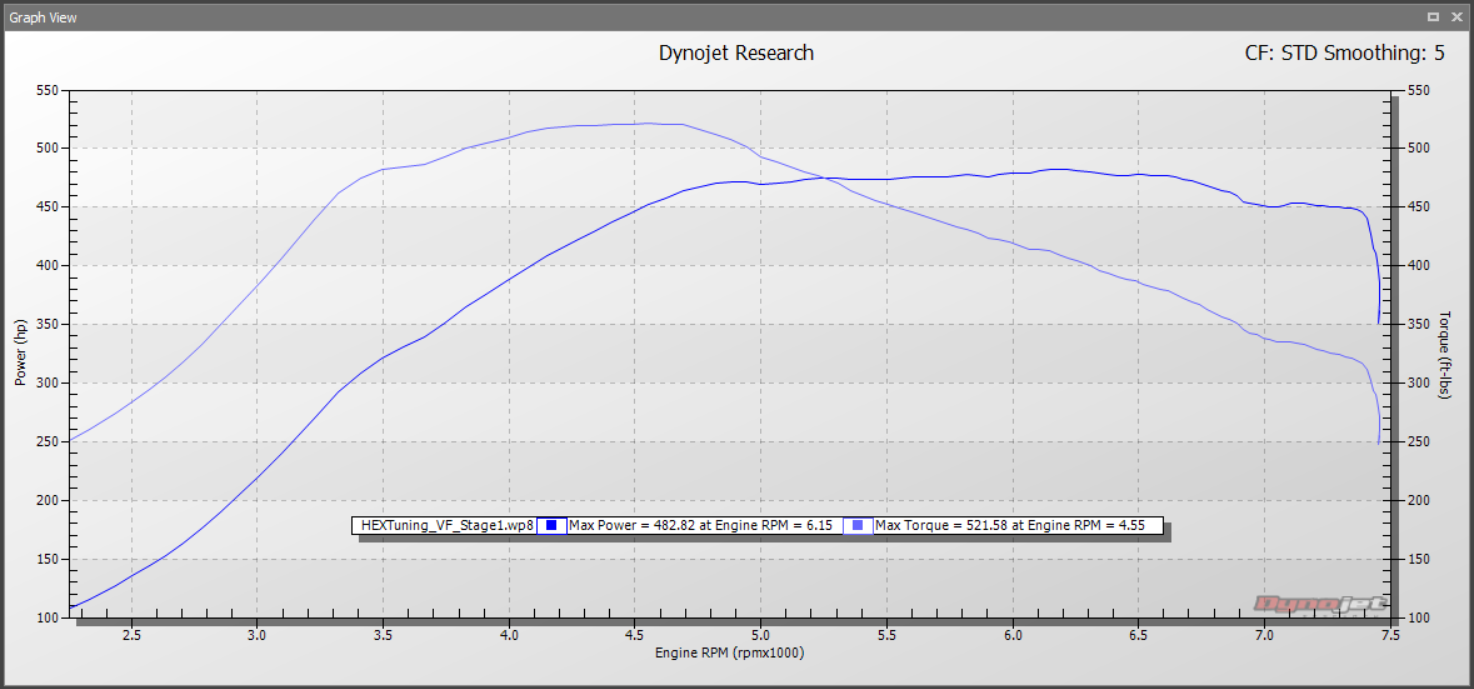
 Stage ONE - STD Correction | Smoothing 5 - 482HP 521TQ
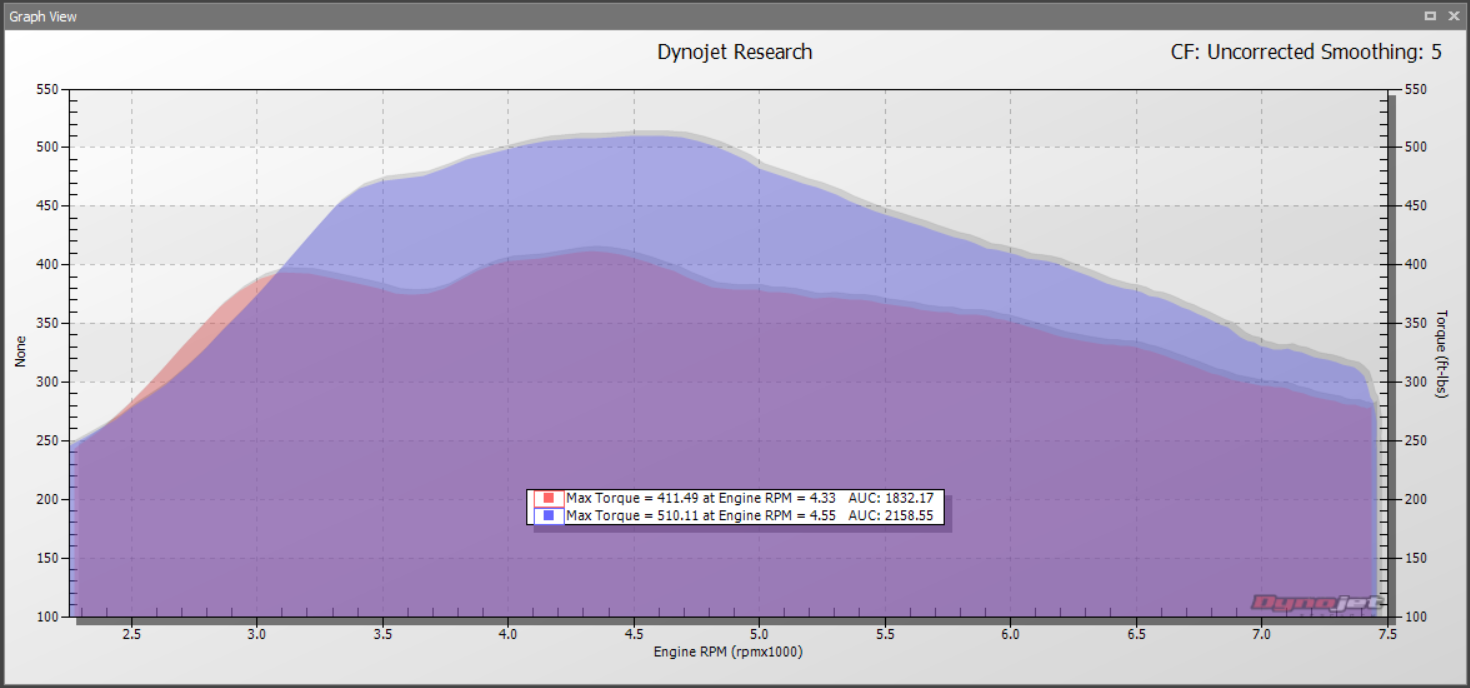
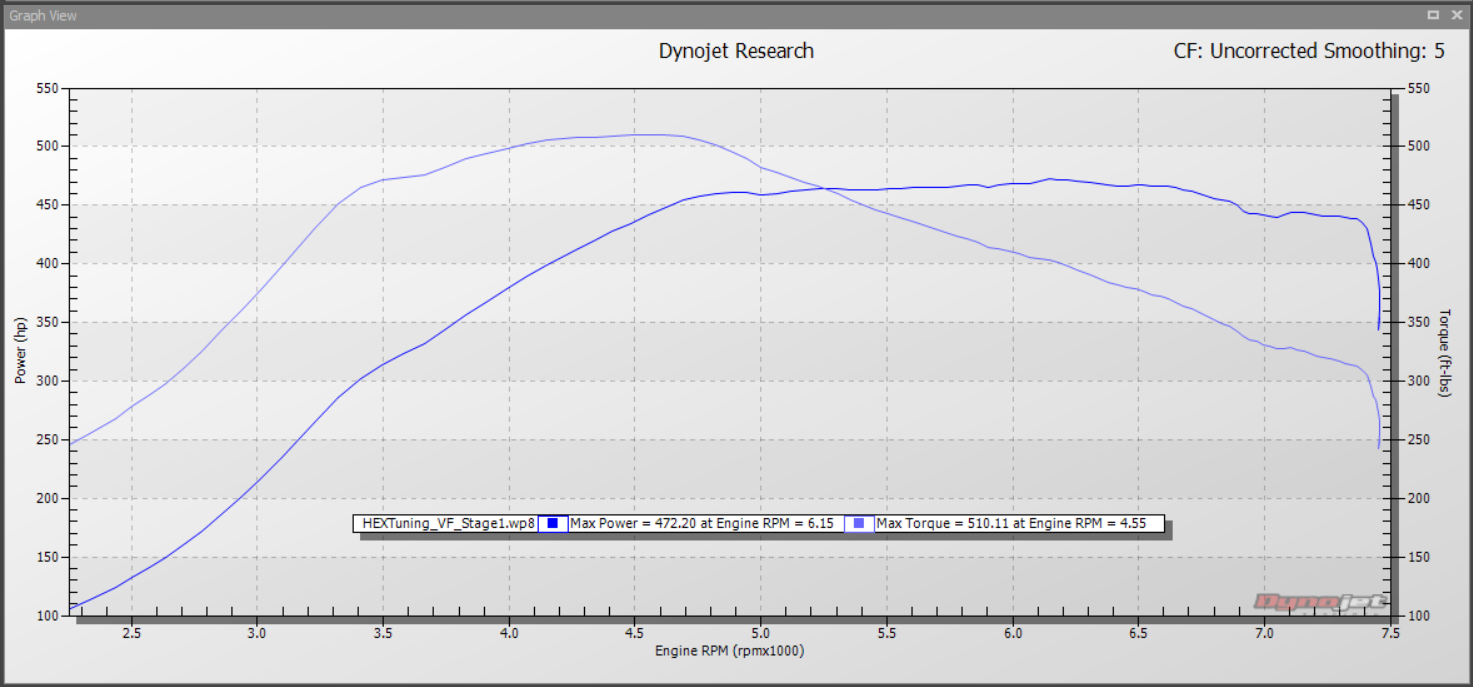
 Stage ONE - Uncorrected | Smoothing 5 - 472HP 510TQ
 Stage ONE - SAE Correction | Smoothing 5 - 471HP 509TQ
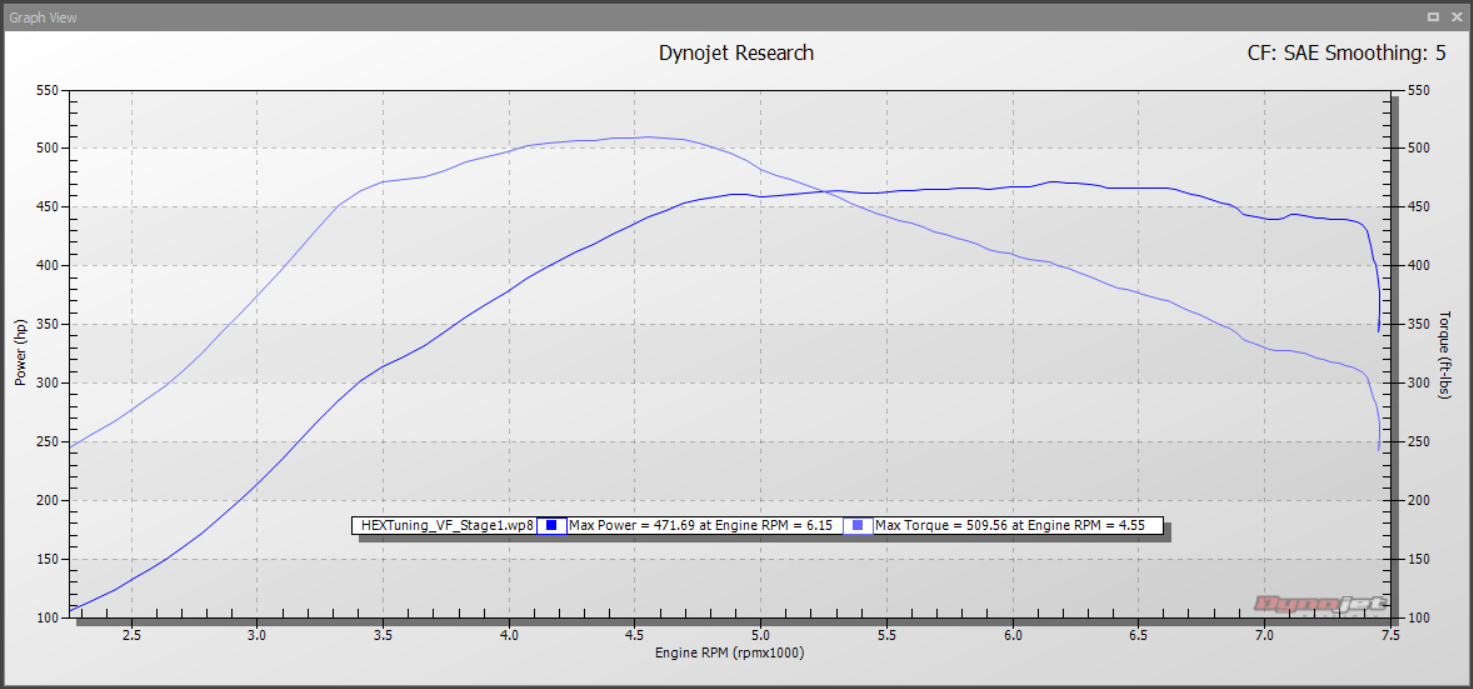
As you can see from the 4 variations of the exact same run above, there is a
deviation of as much as 15HP and 20TQ just by changing the correction
factor and smoothing.
When Uncorrected, the dyno is purely displaying the power at the wheels as
they are measured by the machine. SAE and STD Correction will adjust the
values based on the the relative air temperature, humidity, barometric pressure,
etc. at the test site.
EXAMPLE:
SAE is established at 77°F and 0% Humidity.
STD is established at 60°F and 0% Humidity.
On a 90°F day in July with 70% humidity, the Uncorrected horsepower and
torque will likely read lower than on a cooler day with less humidity.
SAE or SAE Correction will equalize the results as if they were measured at
their respective temperature/humidity. Generally on a warmer day the correction
factor will increase the final results, and on a cooler day the results will decrease.
There are plenty of arguments to be made for or against the use of correction
factors, but we'll save that conversation for another day. At VF Engineering we
prefer to advertise Uncorrected numbers as we feel the results are more
accurate when your before and after dyno results may not take place on the
same day and under the same conditions.
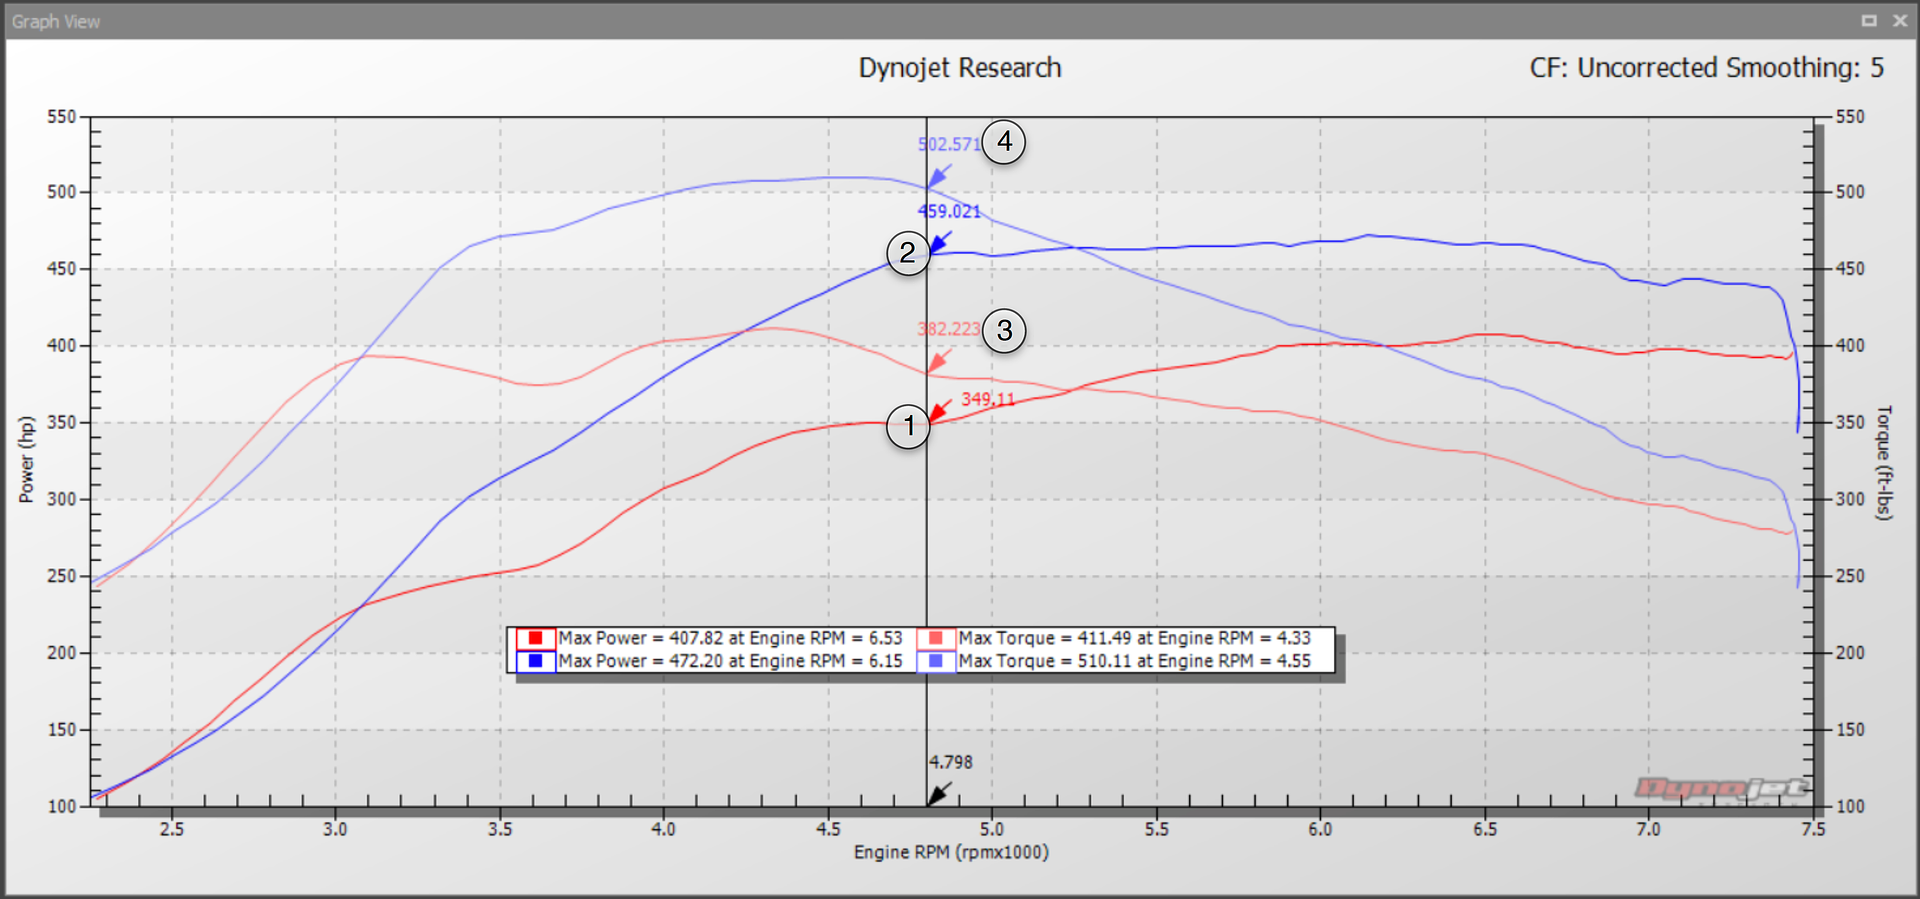
No one would argue that 486HP and 529TQ doesn't sound more impressive than
472HP and 510TQ, but without a baseline the peak numbers mean very little.
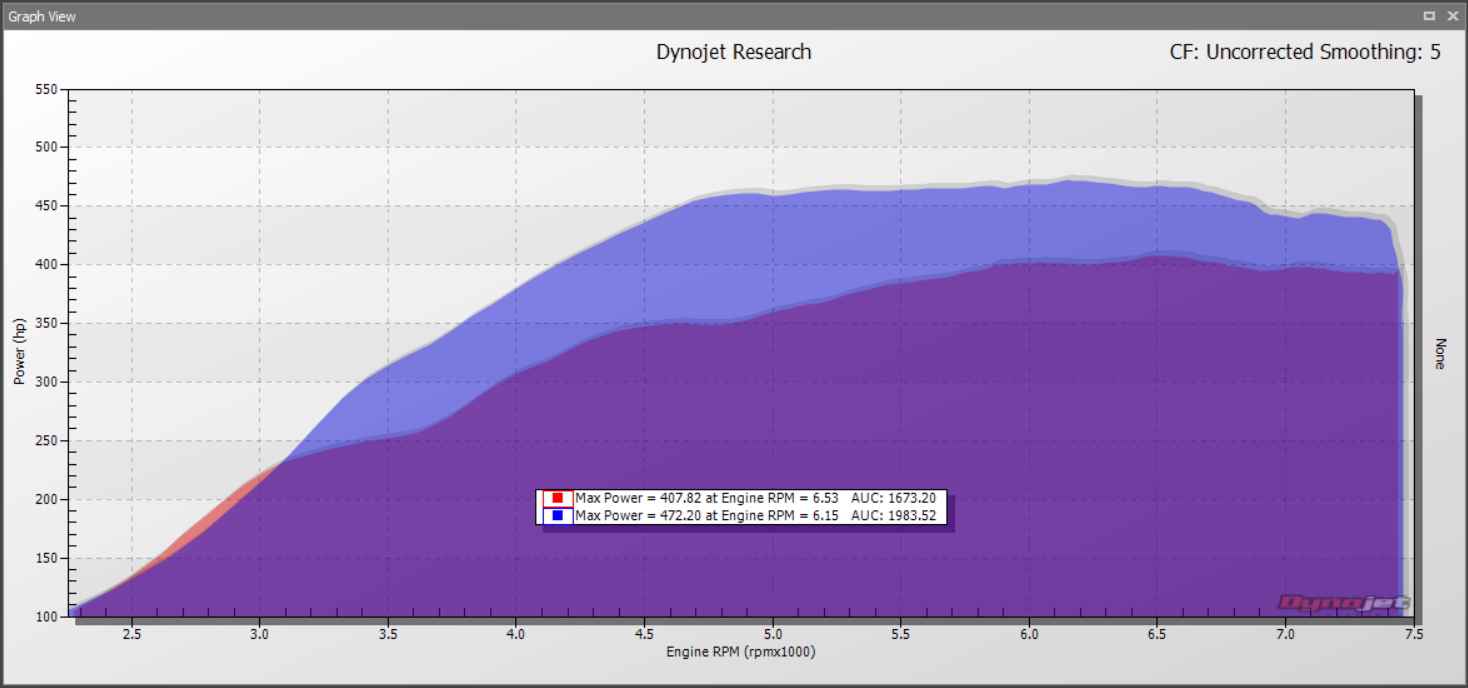
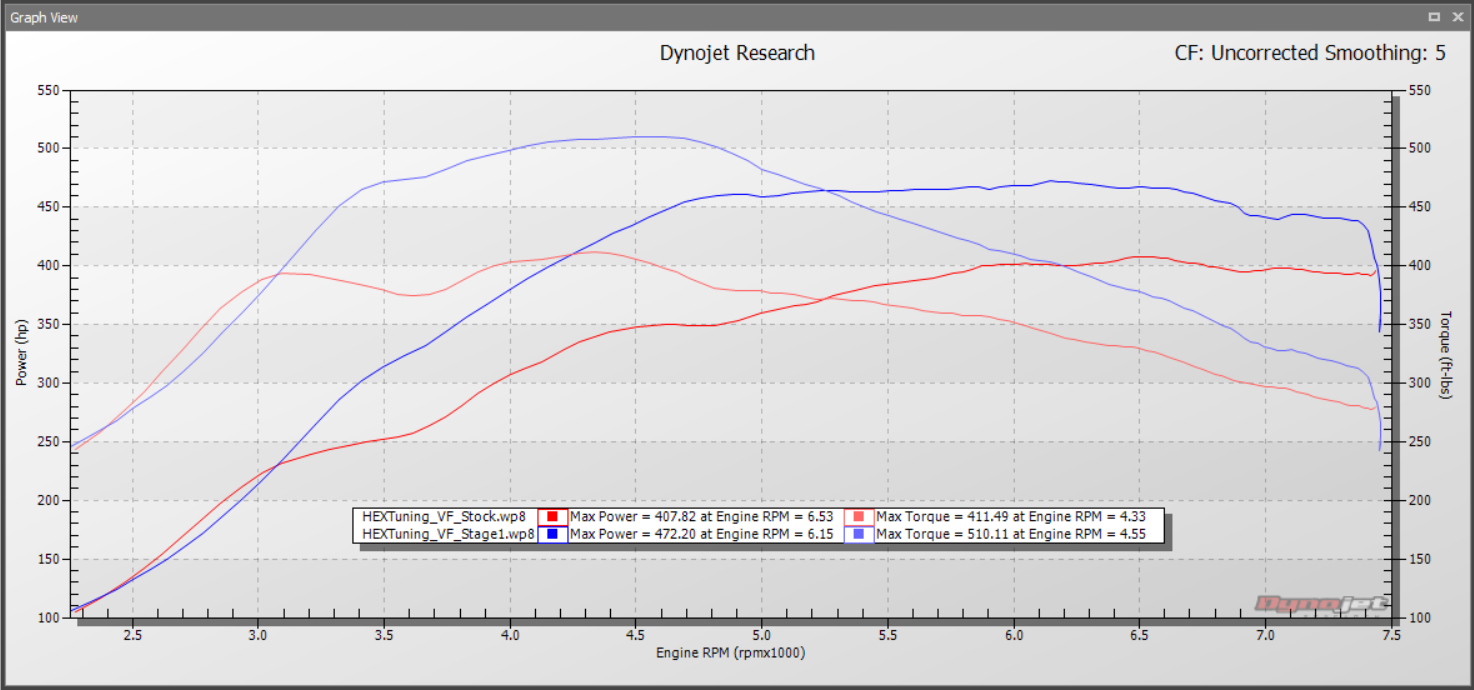
As you will see in the plot below, you start to gain more context when you add
the "before" results, as now you have a baseline in which to determine your gains.
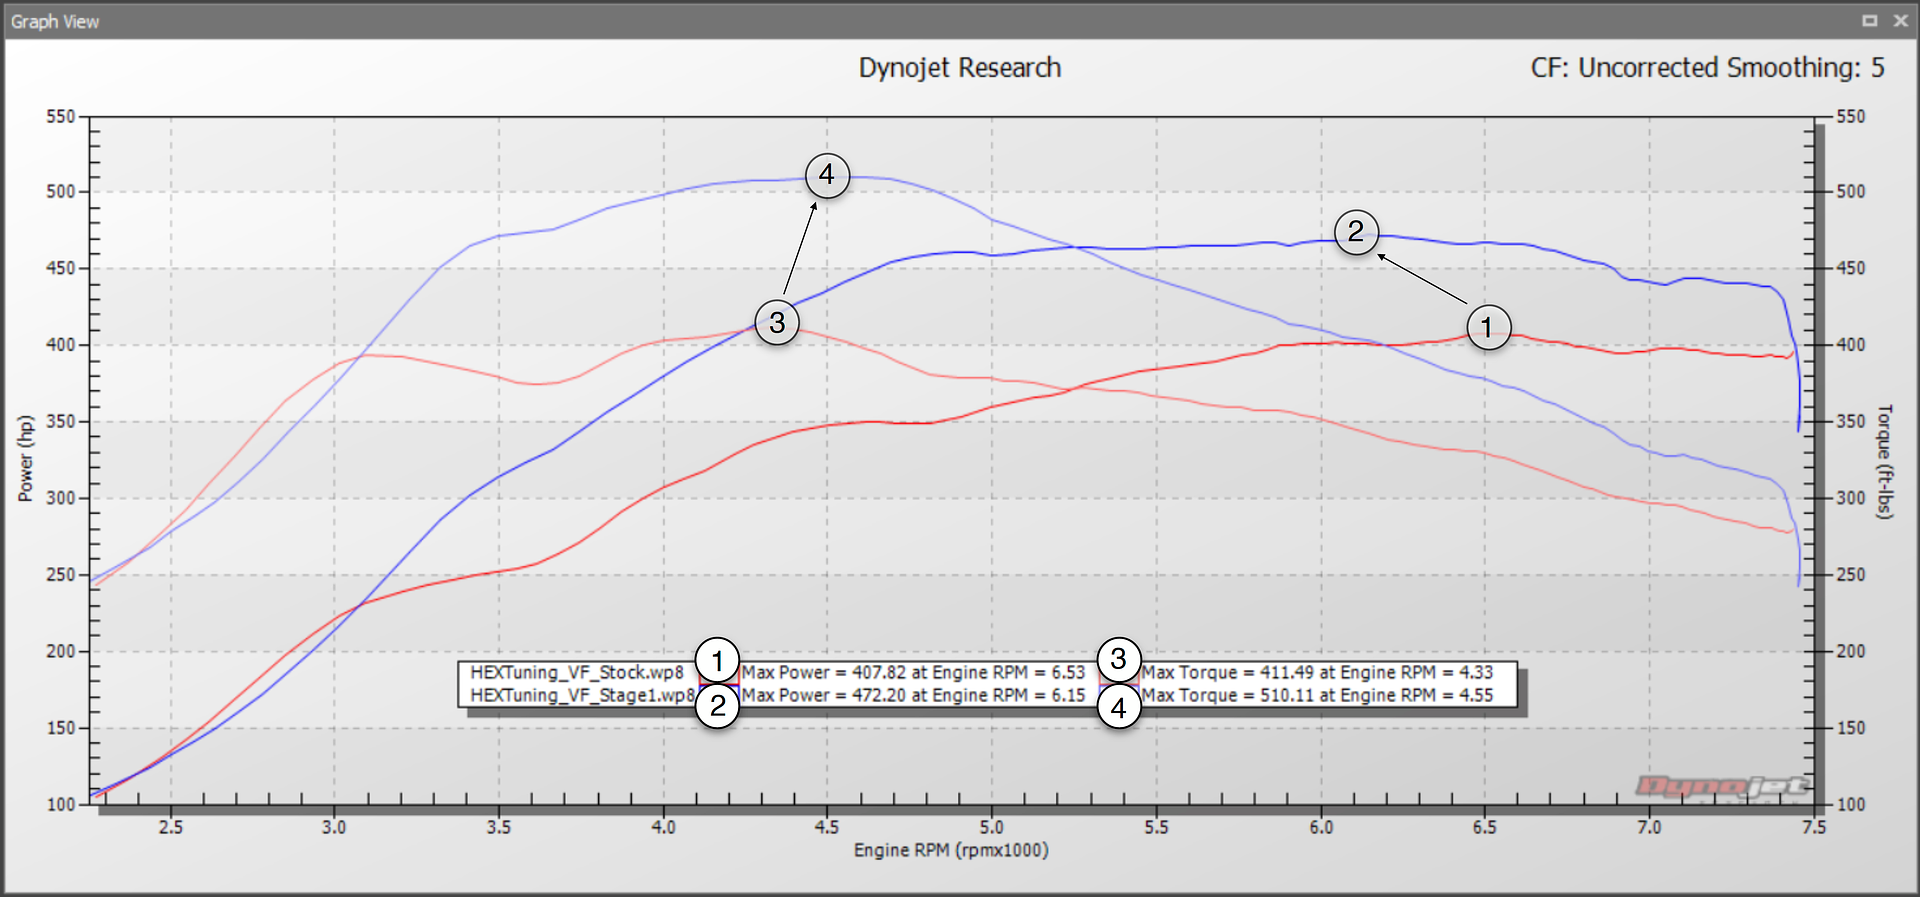
Stock vs. Stage ONE - Unorrected | Smoothing 5 - +64HP +98TQ
If the before and after results we're taken on different days with different
temperatures, the actual delta may differ if more or less correction factor was
applied based on varying conditions. While we're not against the use of Correction
factors, only using them when they work to your advantage should be frowned
upon. We use of Uncorrected ourselves as it leaves less room for scrutiny,
and it's our way of under-promising and over delivering.
Additionally it's not uncommon for some people to post their lowest "before"
result along with their "highest" after result, which yields a more advantageous
delta. We always make it a point to try to ensure that we post averages in order
for our advertised gains to be more realistic, and more repeatable by our
customers who may decide to do independent testing of their own.
The following three back-to-back-to-back runs were from the test vehicle we
used to establish our HEX Tuning Stage ONE marketing results.
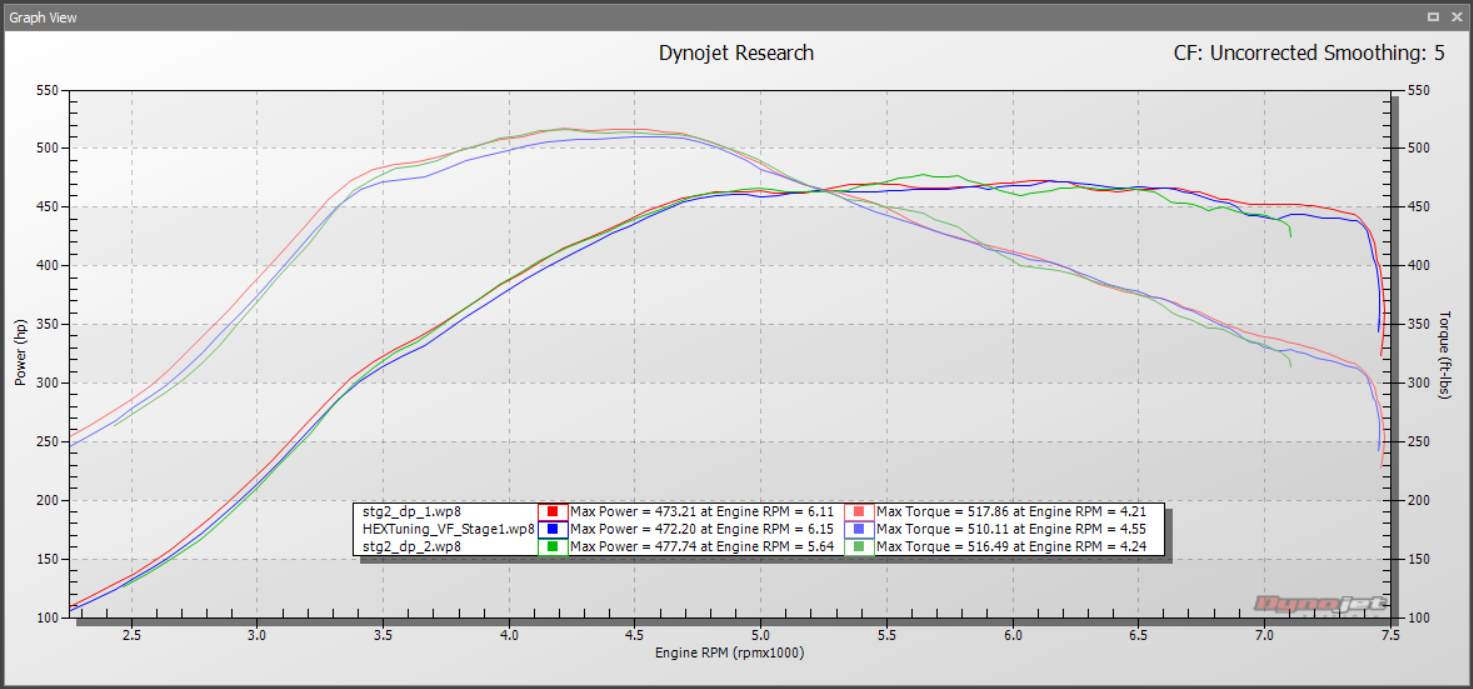
While any of the multiple runs could have been legitimately used for our marketing
purposes, we felt confident that the more conservative approach would serve
much better in the long run as our advertised gains for HEX Tuning Stage ONE
could be achieved even under less than ideal conditions.
The gains for our HEX Tuning Software are always displayed as a range,
representing the variance for different fuel qualities. With Stage ONE being
advertised as +60-70HP and +90-100TQ, we expect our 91 Octane
customers to come in at the bottom of the range, while the expectation for our
93 Octane (or higher) customers would be at the top of the range.
With all the recent talk of "canned tunes", "off the shelf files", "custom tuning"
capabilities (either by the consumer or a local dyno shop) we know that our
customers can be confident in the fact that their HEX Tuned vehicle not only
has the ability to out perform based on consistent real world power, but can
do so under a variety of different conditions and circumstances every time you
pull out of the driveway.
As this thread progresses we'll continue to add more dyno plots along with testing
data that we feel comfortable sharing publicly. While there will be more and more
competition in the market place as time goes on, there are still a lot of differences
between the many options available, and aspects of the S55 motor and MEVD17.2
ECU where we feel we have a distinct advantage.
|